Making Audit Data Useful
Helping enterprise clients understand large amounts of operational data with less cognitive effort.
Project at Glance
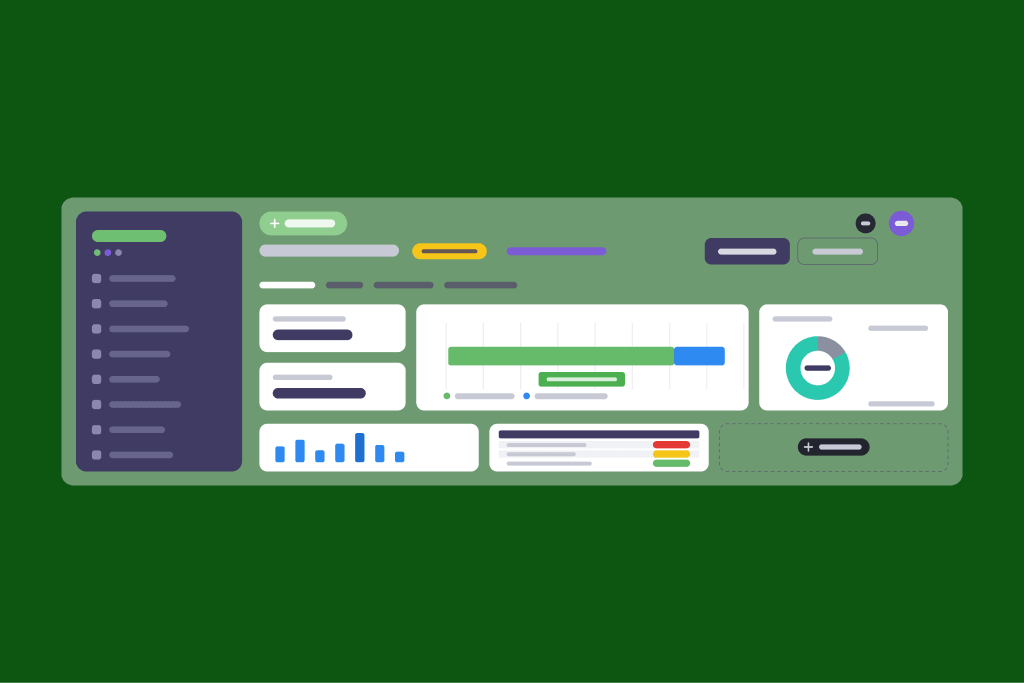
- Contributed to the MVP that onboarded 25+ enterprise clients within the first 8 months, including 2–3 multimillion-dollar retail brands
- Today the platform supports 35+ enterprise customers, with adoption continuing to grow
- Designed for retail intelligence teams managing audit and execution data across thousands of stores
- Reporting experience delivered as part of a broader enterprise SaaS platform used by national retail brands
why this project matters
This project shows my approach to designing an enterprise tool for a complex operational environment. By improving how large-scale field research data was structured and presented, I helped enterprise clients move from reviewing raw data-point results to making faster, more confident business decisions.
Problem & Context
The Growing Complexity
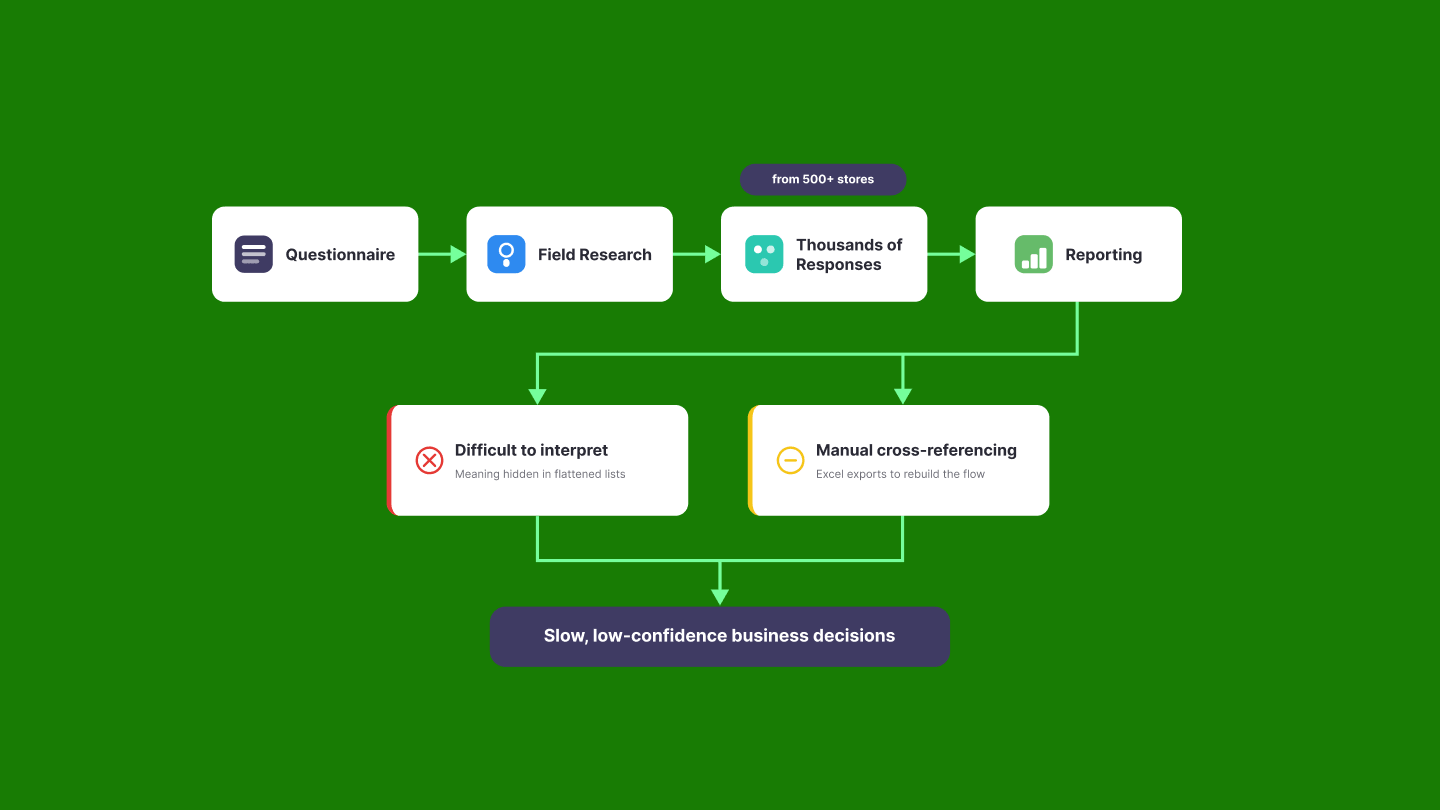
InfoQuest is an enterprise platform where CPG brands commission field research and retail execution programs across thousands of stores in the US and Canada. Field Ops teams collect the data; enterprise clients create the Quests and analyze the results to drive operational and commercial decisions.
As clients expanded the scope of their requests, audits grew more complex - larger datasets, conditional response paths, multiple reporting dimensions. The platform captured all of it; turning raw field data into meaningful insight became progressively harder.
The Real Challenge
The reporting experience faithfully displayed the data but offered little support for assessment. Related responses sat disconnected in long lists, summaries lacked meaningful aggregation, and finding patterns across hundreds of stores meant manual inspection.
For teams monitoring execution at scale, the challenge was no longer collecting data - it was making sense of it.
Research & Systems
Looking Beneath the Data
Discovery
The reporting experience wasn't technically broken - every response was there. But the interface exposed data without helping users understand it. Looking beneath the interface, I found two underlying issues.
Finding 01
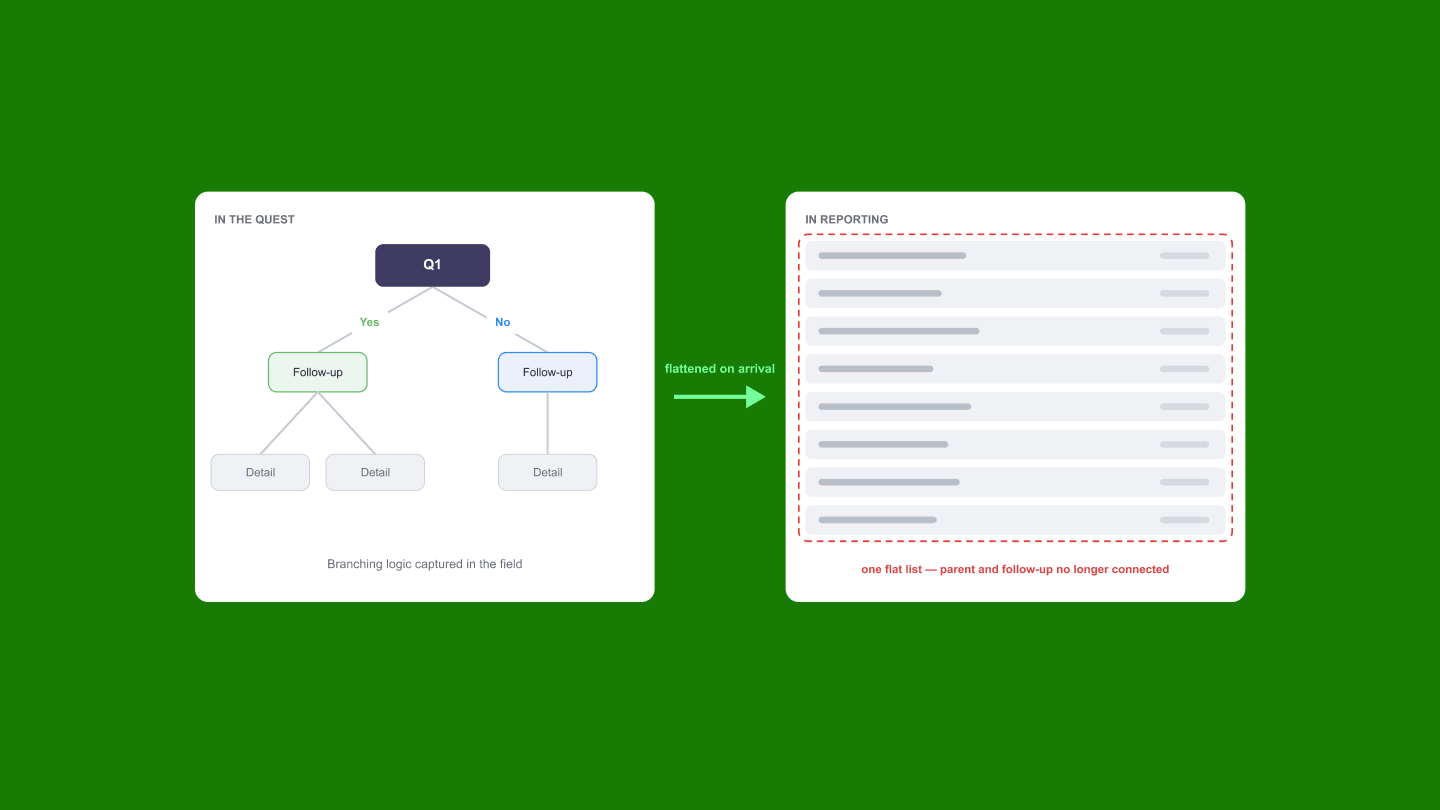
Conditional Quest responses lost their structure
Branching logic existed within a Quest, but once responses reached Reporting they were flattened into a single list. Clients couldn't see how parent and follow-up responses related - and often cross-referenced the Excel export to manually reconstruct the original flow.
Finding 02
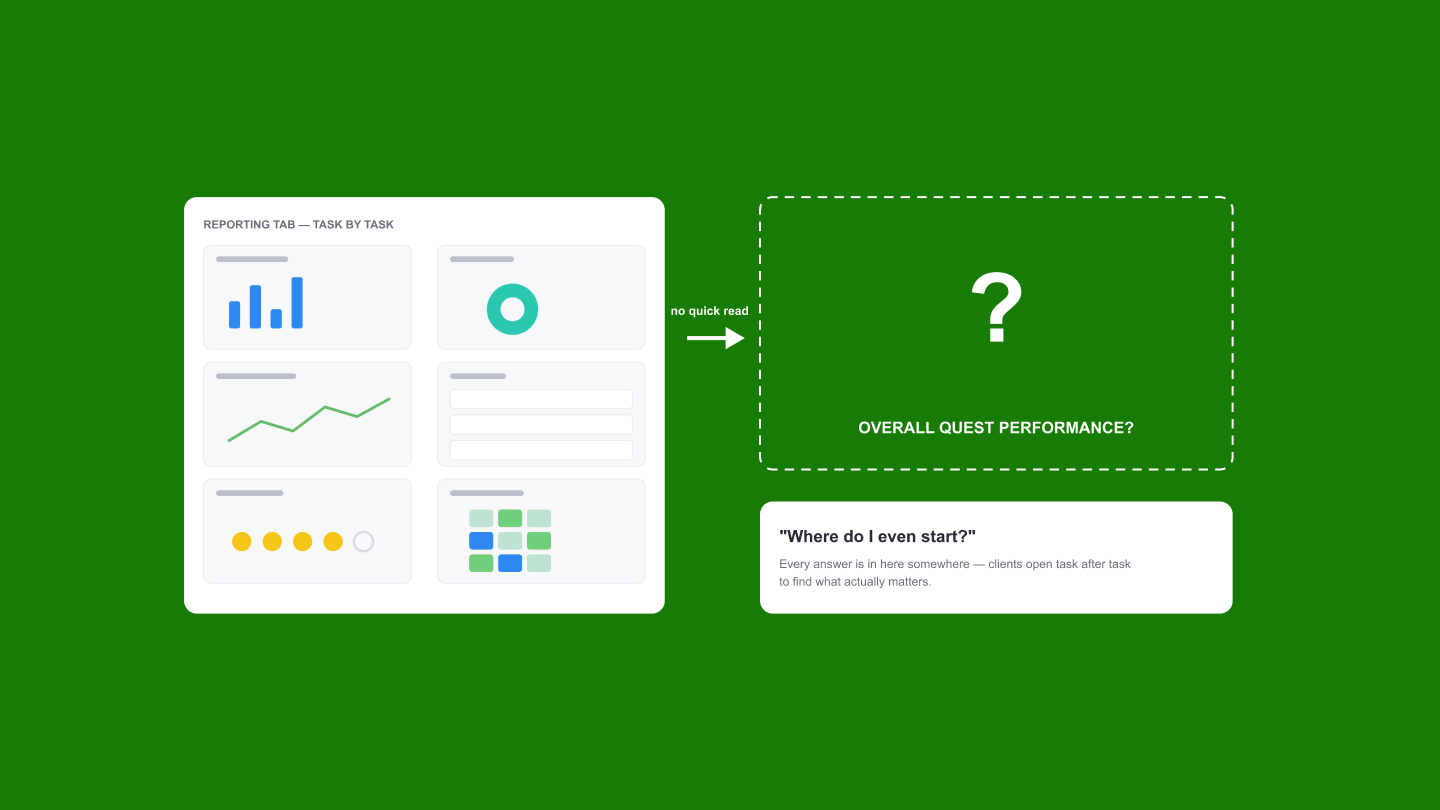
Clients had the data, but not a quick way to understand it
The Reporting tab held detailed data for every task - valuable for investigating specific tasks across hundreds of stores, but rarely where clients began. They first wanted a quick read of overall Quest performance before deciding where to investigate, which meant manually reviewing visualizations across a long list of tasks.
The Core Insight
The platform already provided the data clients needed - it just expected them to do the interpretation themselves. That insight shaped two complementary decisions: restore context within detailed reports, and surface where to begin.
Design Solutions
Design Decision 01
Restoring Context
Conditional logic made fieldwork efficient, but that structure disappeared in Reporting. Users couldn't see how parent and follow-up responses connected and had to reconstruct the flow by hand - repetitive and time-consuming across multiple Quests.
I first mapped how conditional responses flowed through completed Quests, then explored dedicated navigation patterns and nested layouts. Clearer - but more complex, and it forced users to learn a new reporting model.
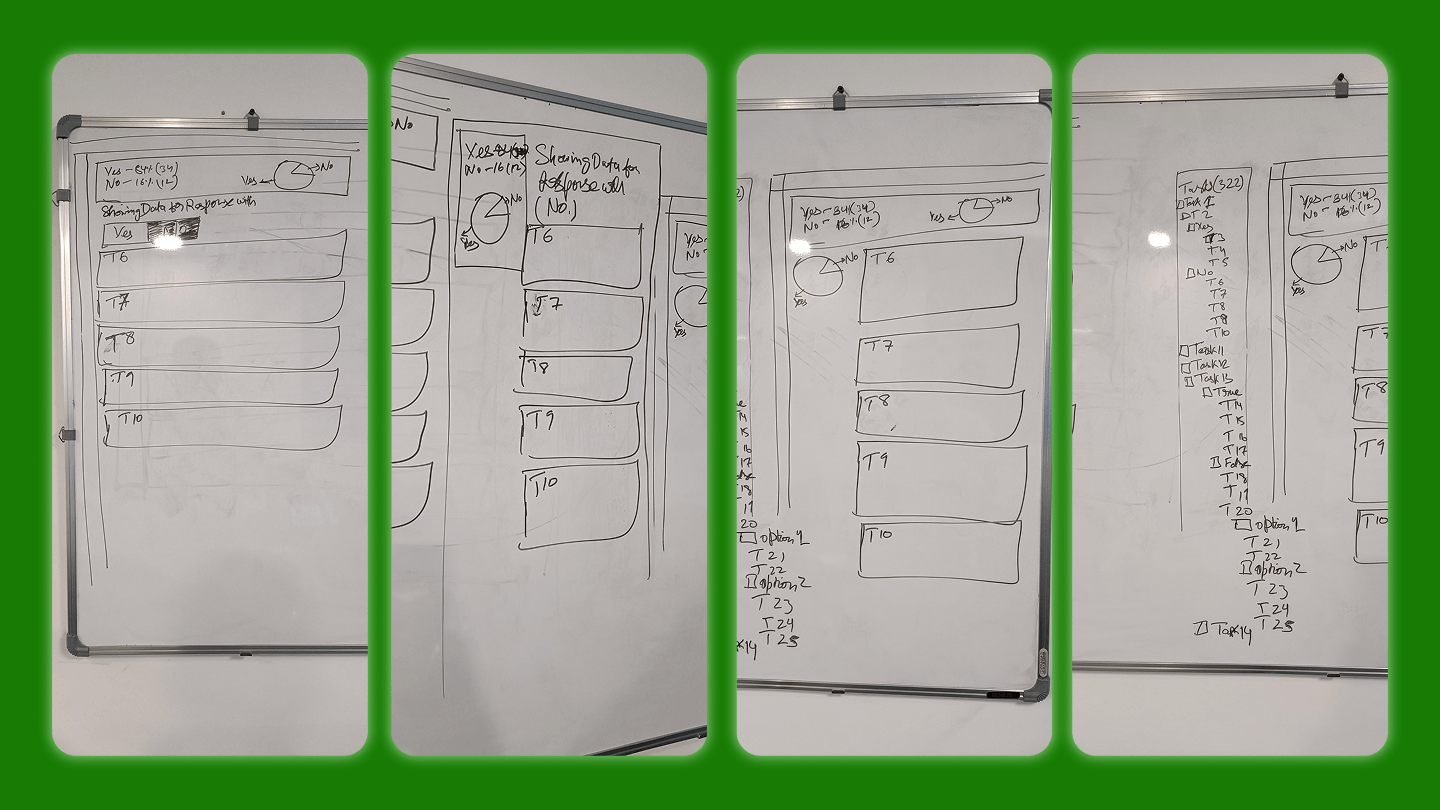
Early explorations focused on preserving response hierarchy while keeping the reporting experience familiar.
Trade-offs
Rather than introducing a new navigation pattern, I looked inside the existing interface. The reporting screen already summarized responses in a pie chart - so I explored whether that visual itself could become the interaction for navigating conditional branches, preserving the mental model with no additional UI.
Final Design
Selecting a pie segment filters the response to that branch, letting users move naturally between parent and follow-up responses while staying in the same view.
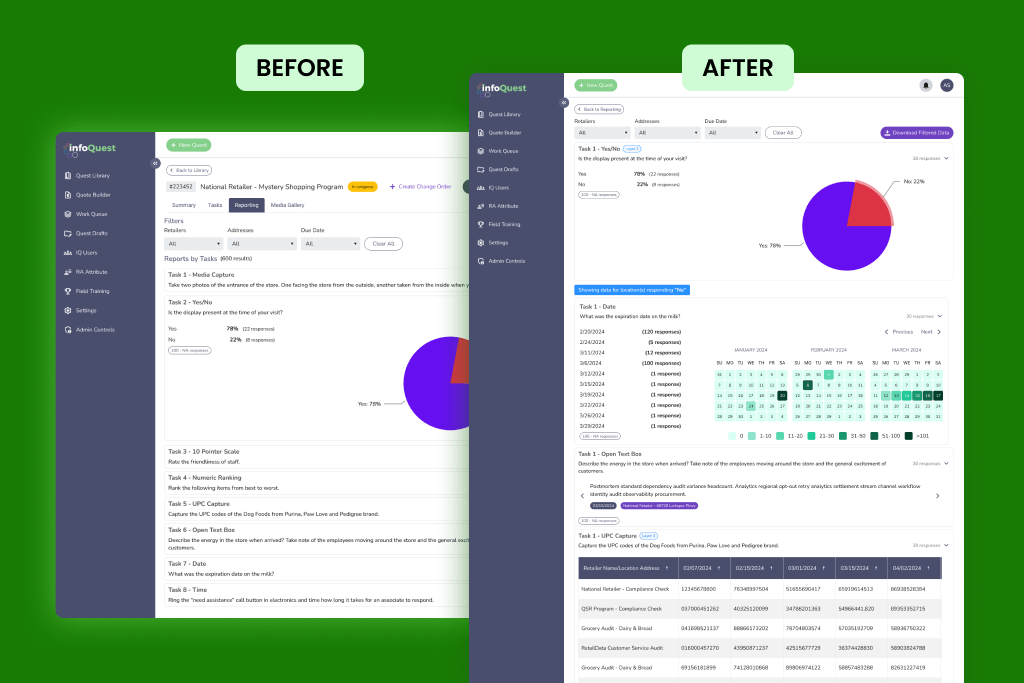
The existing pie chart became an interactive filter, restoring response context without introducing additional interface elements.
Users immediately understood why responses appeared together - no manual reconstruction. Cognitive effort dropped, and completed Quests became easier to interpret.
Design Decision 02
Surfacing What Matters First
With individual response paths understandable, the next challenge was where to begin: a completed Quest can hold hundreds of task results, making it hard to spot what needs attention first.
Stakeholder discussions showed clients didn't want another reporting experience - they wanted a quicker read of overall performance before investigating. That shaped the Summary tab as a configurable starting point rather than another report.
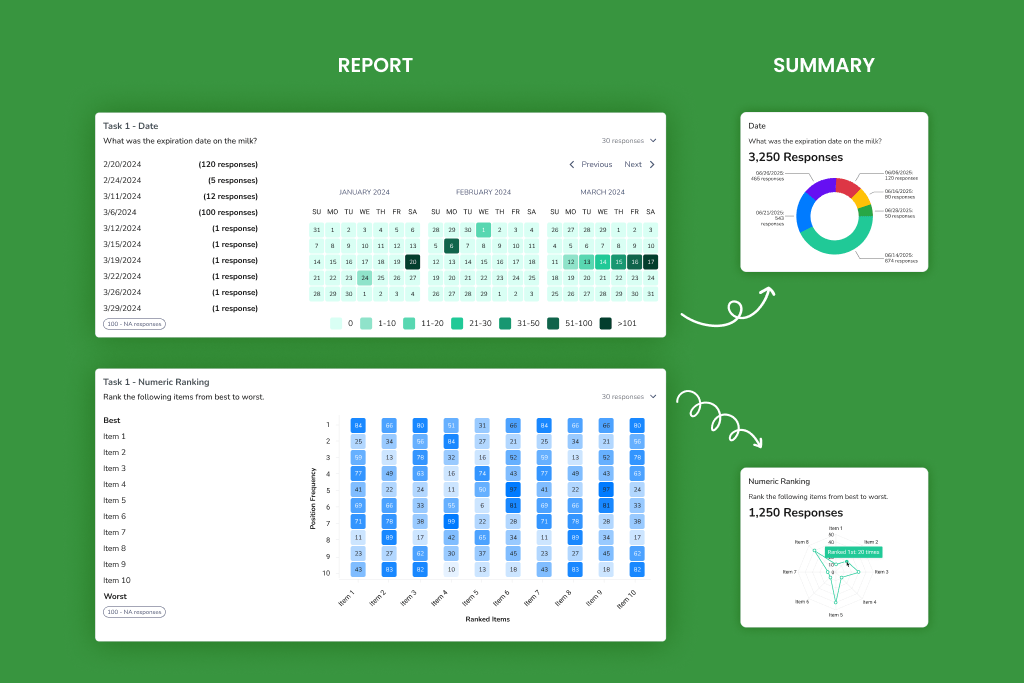
Early explorations focused on identifying which information should be visible immediately versus what should remain one interaction away.
Design Challenge
Every task type represented information differently - rankings, percentages, distributions, compliance scores. The real challenge wasn't designing six cards; it was one summary system representing twenty-one task types without sacrificing the meaning of the data.
Design Decision
Rather than copying the detailed visualizations, I distilled each task to the single most meaningful insight at a glance. A numeric ranking that lived as a heatmap became a card highlighting the top option and how often it appeared. Applied across all task types, the Summary became an orientation layer instead of another report.
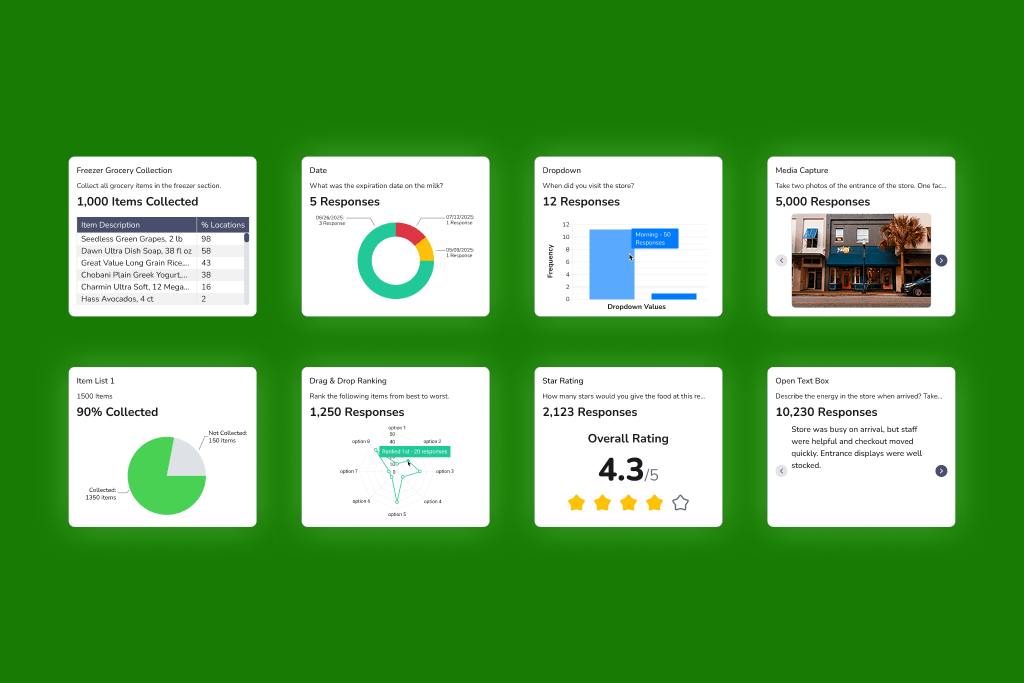
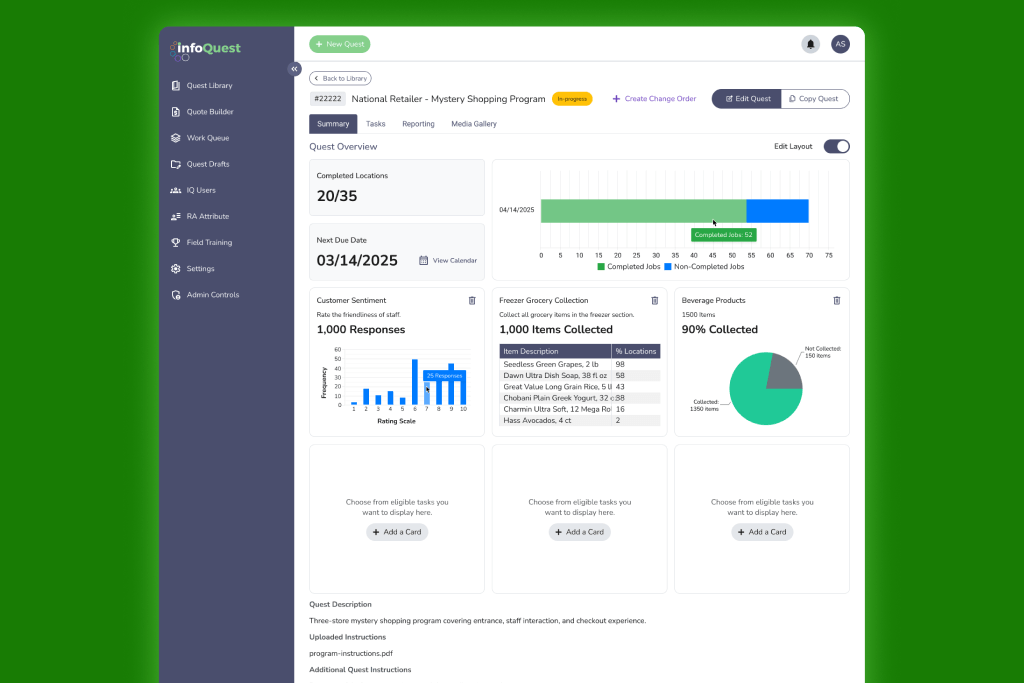
21 summary components organized into reusable patterns, allowing different data types to feel consistent while supporting diverse reporting needs.
Clients got an immediate understanding of overall Quest performance before entering detailed reporting - a faster starting point, with the full dataset still one interaction away.
Bringing It Together
The Summary and Reporting experiences formed one decision-making workflow: begin with a configurable overview, identify what needs attention, move into detail. The redesign didn't reduce the information available - it reduced the effort required to understand it.
Outcomes & Reflection
Where We Are Today
Outcome
The redesigned reporting aligned with how enterprise clients actually analyze Quest data: identify what needs attention first, then go deeper. Faster interpretation, without losing access to the detail.
Reflection
This project changed how I approach enterprise reporting. Instead of treating screens as isolated problems, I design the journey from information to action - because in complex products, helping users understand the data they already have is often more valuable than exposing more of it.
 Enterprise • Workflow DesignGuiding Better Field Execution
 Mobile • Visual DesignDesigning Trust for Sensitive Health Journeys
 Enterprise IoT • DashboardsDesigning for High-Stakes Operations
 Multi-surface DesignKeeping the Night Alive